Renewable developers are in a hard space. On the one hand, they are in a race to get leasehold agreements in place, submit interconnect applications, and break ground to keep investors happy. On the other hand, they have a lot of due diligence to conduct before they invest too much. It can be devastating to invest hundreds of thousands of dollars into a site only to find your estimates for materials, vegetation clearing, and stormwater are all wrong. Or worse, that you can’t use the site at all.
So what are the best analytics renewable developers (and the engineers that work with them) should focus on to move from “site selection” to “shovel-ready” quickly but confidently? Teren’s experts looked at the problems that pop up every day in renewable development and highlight the four analytics below.
Top 4 Analytics for Renewable Developers
1. Hydrology Analytics
Hydrology analytics model the flow paths and localized watersheds that can impact the project design, construction, and long-term resiliency of the site. These analytics are critical for effectively informing the site suitability, optimizing landform construction practices, and assisting in the development of stormwater plans. Additionally, hydrology analytics like modeling around 100yr flood events provide additional insights into potential inundation and problematic flow paths once your site is operational, and also fulfill increasing regulatory requirements.
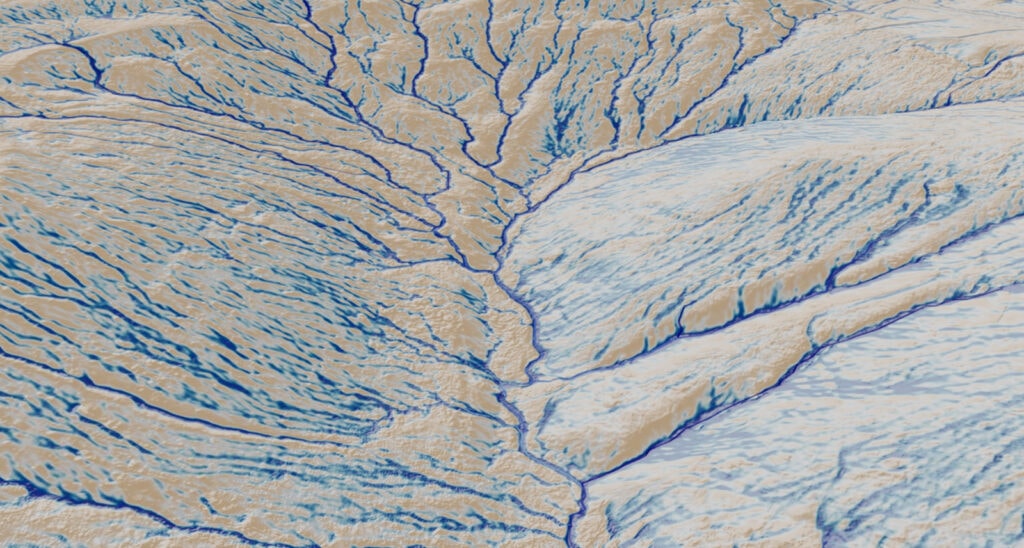
Surface Hydrology Analytics
2. Clearing Analytics
Clearing quantity analytics identify individual trees, delineate their canopies, and estimate tree height, basal area, and canopy cover to inform vegetation clearing and timber harvesting.
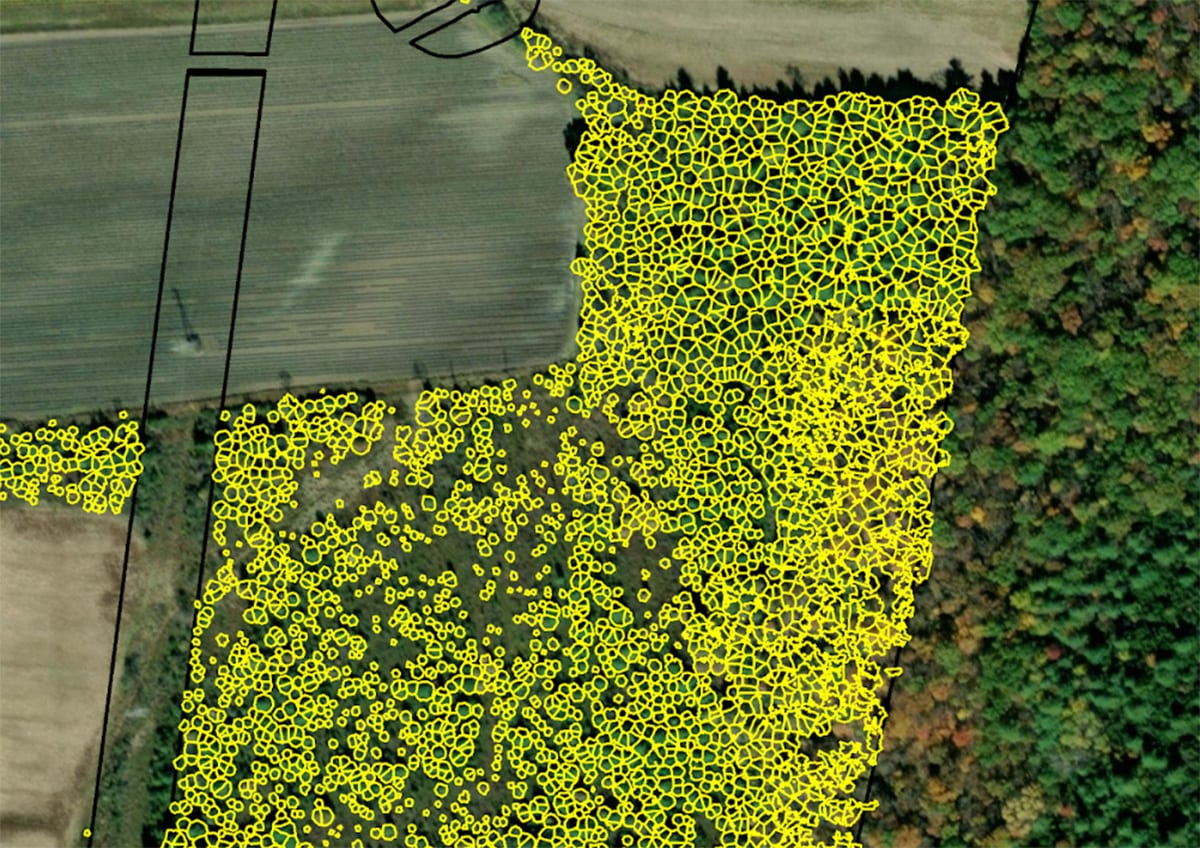
Tree Clearing Analytic
3. Tree Shading Analytics
Tree shading analytics model the extent of shadows projected by trees within 20 feet outside of the project site boundaries during spring and fall equinoxes as well as summer and winter solstices. The analytic visualizes the number of times an area within the project boundary is shaded by adjacent trees at equinoxes and solstices during the year.
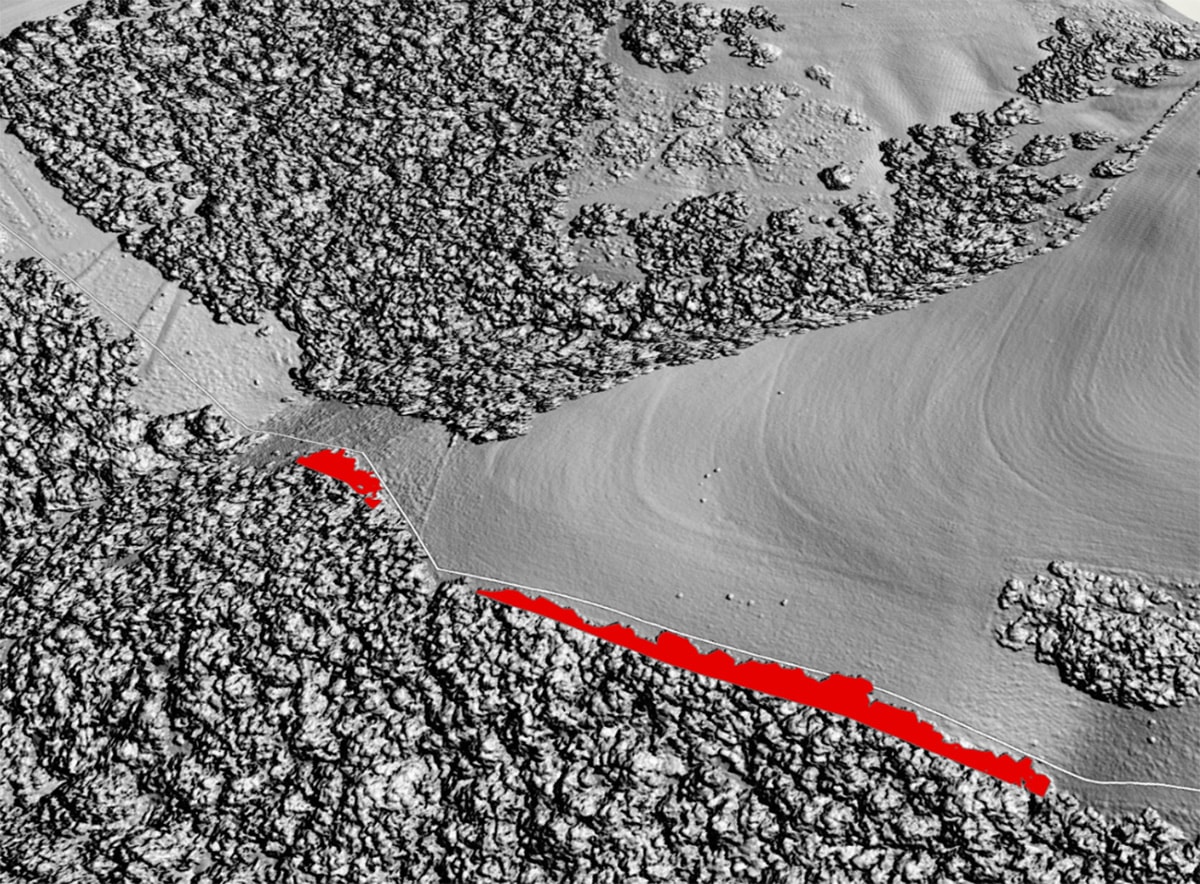
Shaded Area Analytic
4. Terrain Analytics
Terrain analytics include both a Digital Terrain Model (DTM) and a Digital Surface Model (DSM). DSM is an image derived from the first return of the LiDAR scan and contains all of the site’s surface features such vegetation cover, structures, roads, fences, etc. DTM is an image derived from the last return of the LiDAR scan and contains all of the site’s bare earth topographic features without surface features such as vegetation or structures.
Terrain analytics are similar to a traditional site survey but contain much more detail about the topography of the site. Terrain analytics are used to generate contours, perform cut/fill analysis, hydrology/stormwater analysis, shading/clearing analysis, and aid in other pre-construction site assessments.
Cleared Digital Surface Model to Show Digital Terrain
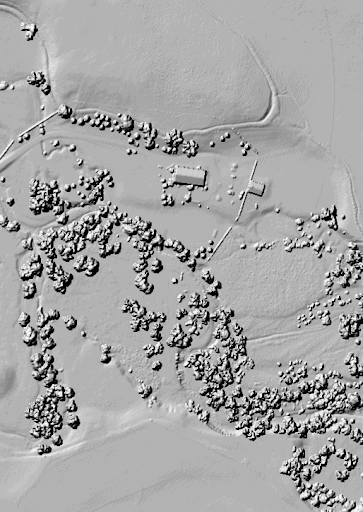
Digital Surface Model
Better Data Means Better Decisions
We’ve found over and over that developers can get a more accurate assessment of what’s happening on the site and leverage that information to make more informed decisions and cost estimates. With Teren, they can make that race to market faster, all while knowing they’ve conducted the highest quality assessment of the site possible.
Want to learn more?
Contact Teren to schedule a demo or learn more about our analytics for renewable development.